WEAVR Dashboard
The WEAVR Dashboard is the central hub of WEAVR Creator: it shows where your project stands and gives one-click access to every WEAVR tool, organized by job. It replaces the old Intro page.
Open it from WEAVR > Dashboard, or from the grey WEAVR logo button in the Unity toolbar (just to the left of the login chip).

The dashboard is split into six tabs — Home, Scenes, Procedures, Build, Utilities and Documentation — and, at the bottom, a footer showing the number of tools, the WEAVR and Unity versions, an Open on startup toggle, and Refresh / Docs buttons.
Home
The Home tab summarizes where the project stands and lets you jump back into what you were working on.
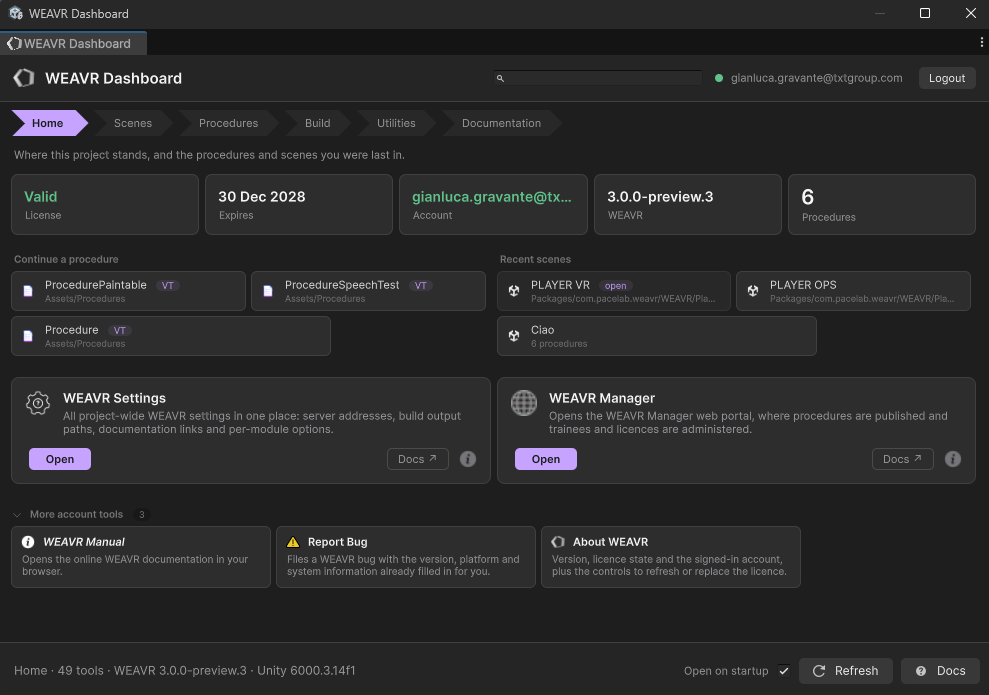
- Status cards — your License state, its expiration date, the signed-in account, the WEAVR version, and the number of procedures in the project.
- Continue a procedure — the procedures you last opened.
- Recent scenes — the scenes you last worked in.
- WEAVR Settings — opens the Settings window (server addresses, build output paths, per-module options).
- WEAVR Manager — opens the WEAVR Manager web portal, where procedures are published and trainees and licences are administered.
- More account tools — WEAVR Manual (this documentation), Report Bug (files a bug with version/platform info pre-filled), and About WEAVR (see Login & License).
Scenes
The Scenes tab is where you turn Unity scenes into WEAVR scenes and configure the project for a device.
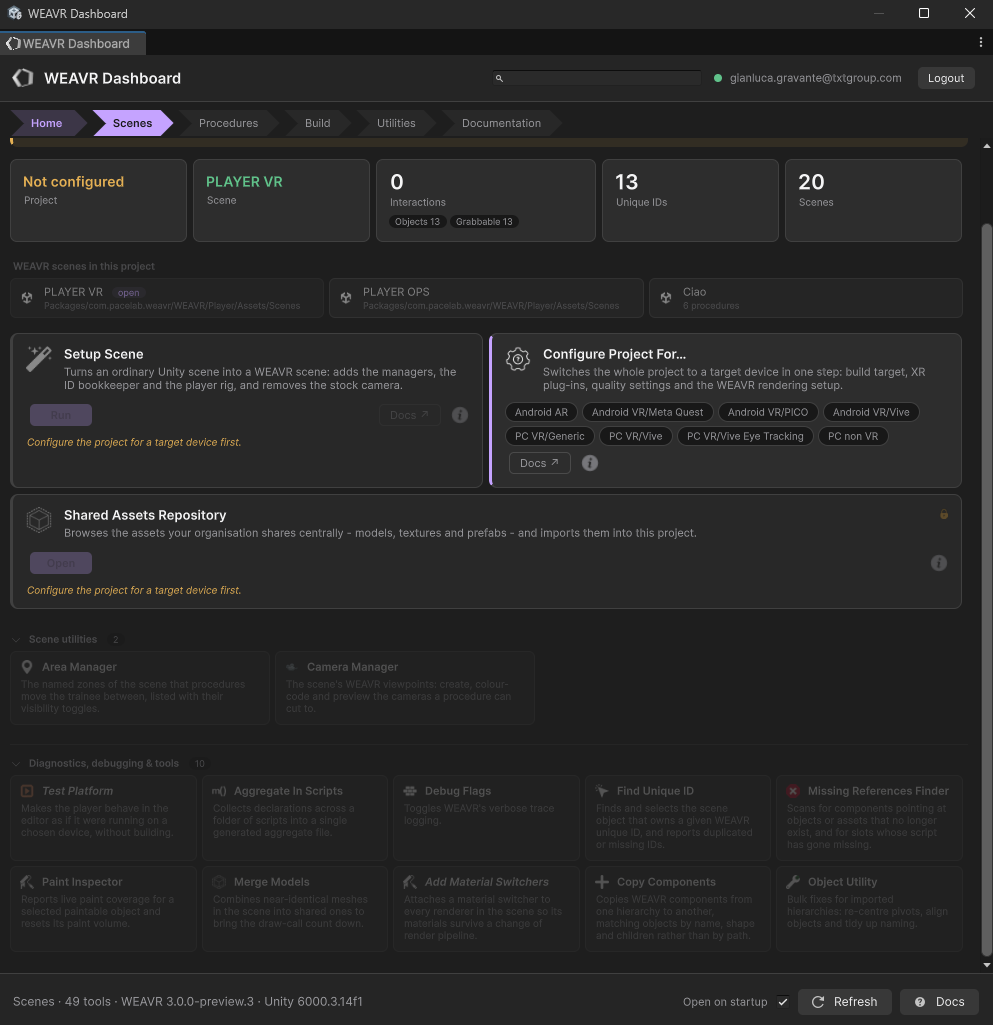
- Status cards — whether the project is configured, the current scene, the number of interactions, unique IDs and scenes.
- Setup Scene — turns an ordinary Unity scene into a WEAVR scene (adds the managers, the ID bookkeeper and the player rig, and removes the stock camera).
- Configure Project For… — switches the whole project to a target device in one step (build target, XR plug-ins, quality settings and the WEAVR rendering setup): Android AR, Android VR (Meta Quest / PICO / Vive), PC VR (Generic / Vive / Vive Eye Tracking) or PC non-VR.
- Shared Assets Repository — browse and import shared assets (see Shared Assets Repository). Requires the project to be configured for a target device first.
- Scene utilities — Area Manager and Camera Manager.
- Diagnostics, debugging & tools — Test Platform, Debug Flags, Find Unique ID, Missing References Finder, Paint Inspector, Merge Models, Add Material Switchers, Copy Components, Object Utility, and more.
Procedures
The Procedures tab groups everything about authoring, inspecting, translating and scoring procedures.
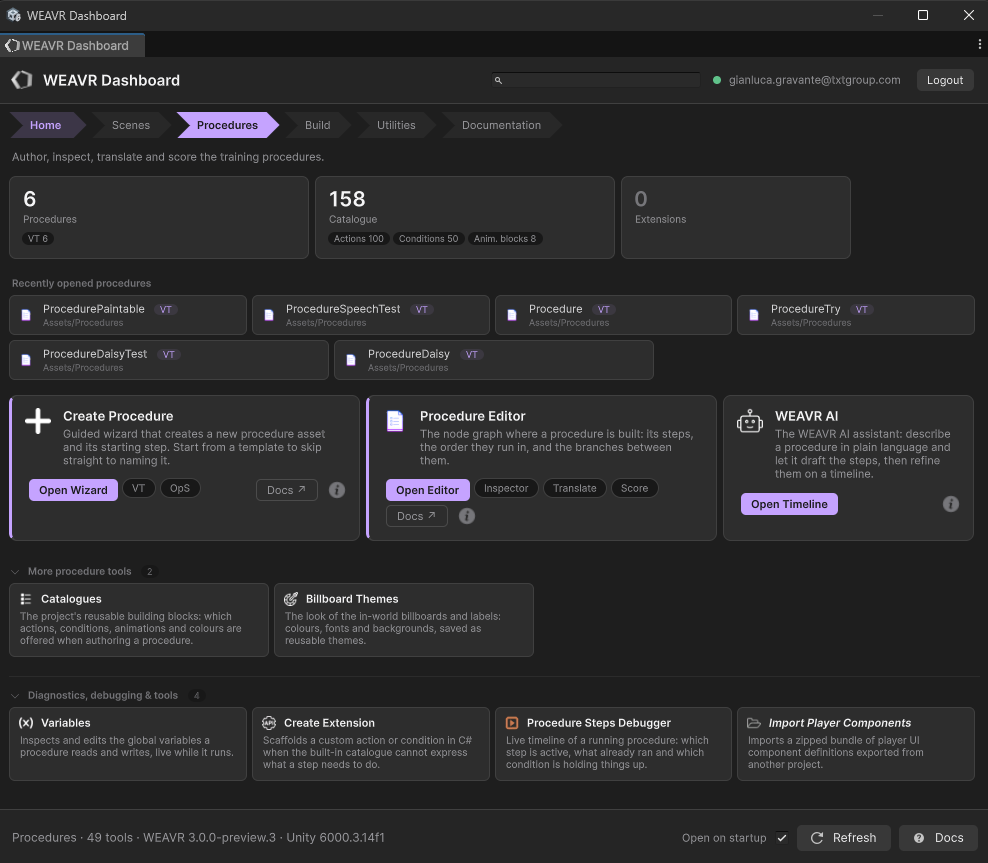
- Status cards — the number of procedures, the catalogue totals (actions, conditions, animation blocks) and the number of extensions.
- Recently opened procedures.
- Create Procedure — the Create Procedure wizard (VT / OpS templates).
- Procedure Editor — opens the Procedure Editor, with quick access to the Inspector, Translate and Score windows.
- WEAVR AI — opens the WEAVR AI timeline.
- More procedure tools — Catalogues and Billboard Themes.
- Diagnostics, debugging & tools — Variables, Create Extension, Procedure Steps Debugger, Import Player Components.
Build
The Build tab produces the players and the assets shipped alongside them.
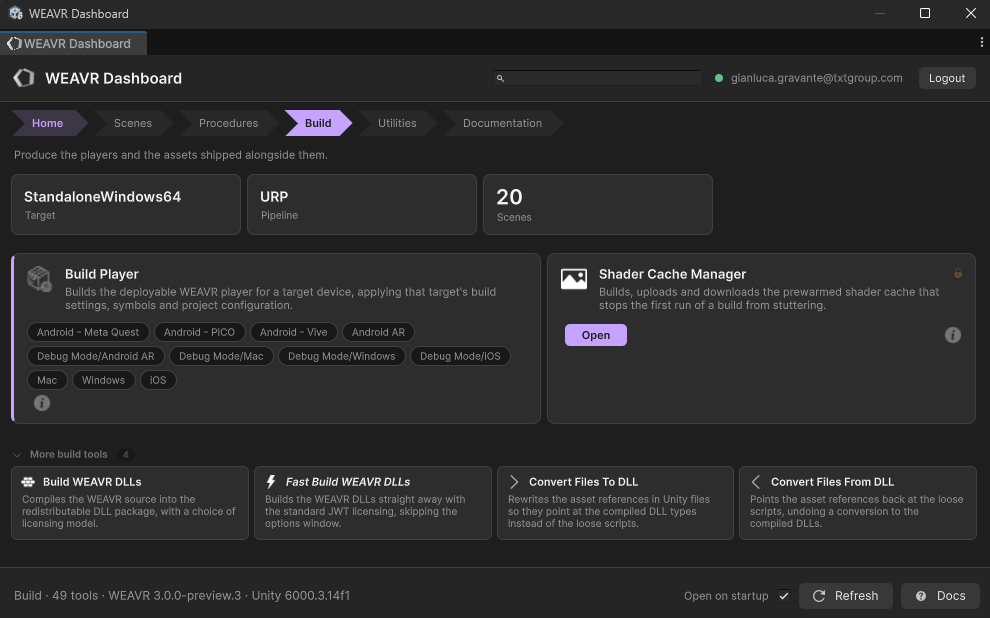
- Status cards — the current build target, render pipeline and number of scenes.
- Build Player — builds the deployable WEAVR player for a target device (applying that target's build settings, symbols and project configuration): Meta Quest, PICO, Vive, AR, the various Debug modes, Mac, Windows and iOS.
- Shader Cache Manager — builds, uploads and downloads the prewarmed shader cache that stops the first run of a build from stuttering.
- More build tools — Build WEAVR DLLs, Fast Build WEAVR DLLs, Convert Files To DLL and Convert Files From DLL.
Utilities
The Utilities tab collects low-level utilities for debugging WEAVR itself — rarely needed day to day.
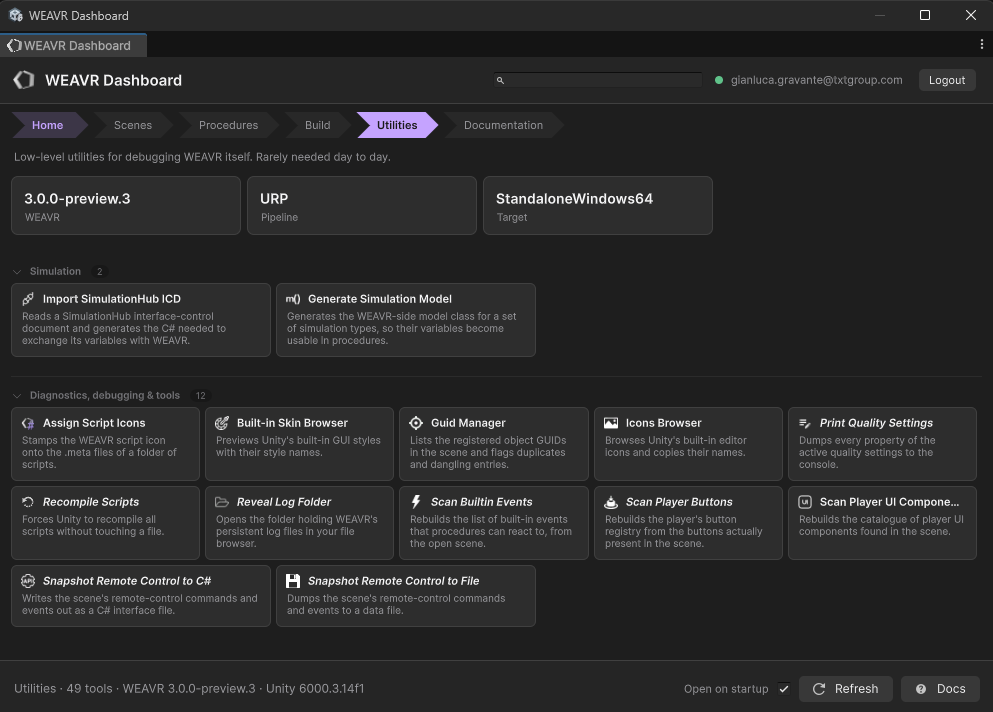
- Simulation — Import SimulationHub ICD and Generate Simulation Model (Developer Simulation Hub).
- Diagnostics, debugging & tools — Assign Script Icons, Built-in Skin Browser, Guid Manager, Icons Browser, Print Quality Settings, Recompile Scripts, Reveal Log Folder, Scan Builtin Events, Scan Player Buttons, Scan Player UI Components, and Snapshot Remote Control to C#/File.
Documentation
The Documentation tab is a page-by-page index of the online manual; every link opens in your browser.
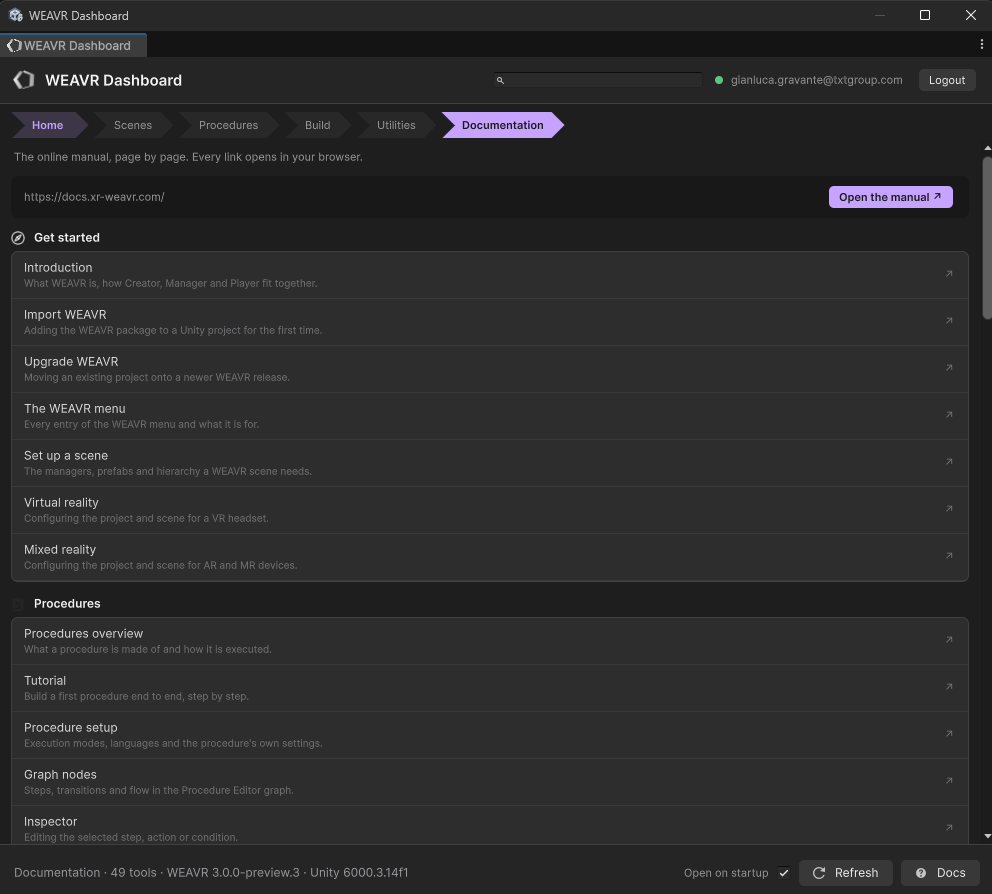
It lists the manual URL with an Open the manual button, followed by the documentation grouped by section (Get started, Procedures, and so on).
You don't have to look a page up by hand: most WEAVR components have a ? (help) button in their Inspector header. Clicking it opens this online manual directly at the section that documents that component.